Our journey in creating an enterprise dashboard for our SaaS platform
I have always been impressed with operational dashboards – the sort of thing you see in a high-tech control room. I love the idea that from a few huge monitors you could understand the state of a complex system and keep it all running smoothly.
When we built our SaaS platform, dashboarding was always on the to-do list, but sadly it’s the sort of thing that gets bumped by more urgent development priorities.
Over the years we had several goes at getting a functional operational dashboard. Early in the piece we had basic service monitoring where we could log in and check the health of all micro-services on an environment. We also had monitoring and logging in place to track system health and provide automated alerts. Putting this all together in a single slick dashboard however proved difficult.
One of the main challenges was choosing a starting point. We had several repositories of data such as logging from our health monitor, Azure logging and logs within each environment. We also had a host of tooling such as Power BI, Azure Application Insights or even the ability to build it ourselves in our own admin portal.
After several failed attempts internally, we made the decision to bring in external consultants to help us use Azure Application Insights as a central data hub and Azure Dashboarding as the presentation layer.
Once that was in place, we could focus on why we actually wanted the dashboard (apart from wanting something that looked impressive). We isolated the key questions we wanted the dashboard to answer such as:
What is the health of the infrastructure in an environment?
How much load is going through each environment?
What is the relationship between transactional volumes and infrastructure load?
Is something unusual happening on an environment? (Nice vague question)
And many more
It turned out that while we had lots of data, we did not have all the right data in the right place to answer our questions. To provide real intelligence, we improved our telemetry by combining the infrastructure logging Azure provided with the transactional information our services generated.
With that in place we could put our dashboard together in Azure. This turned out easier than expected, except for the challenge of making all the time axis tiles match up properly so that the graphs are all visually related.
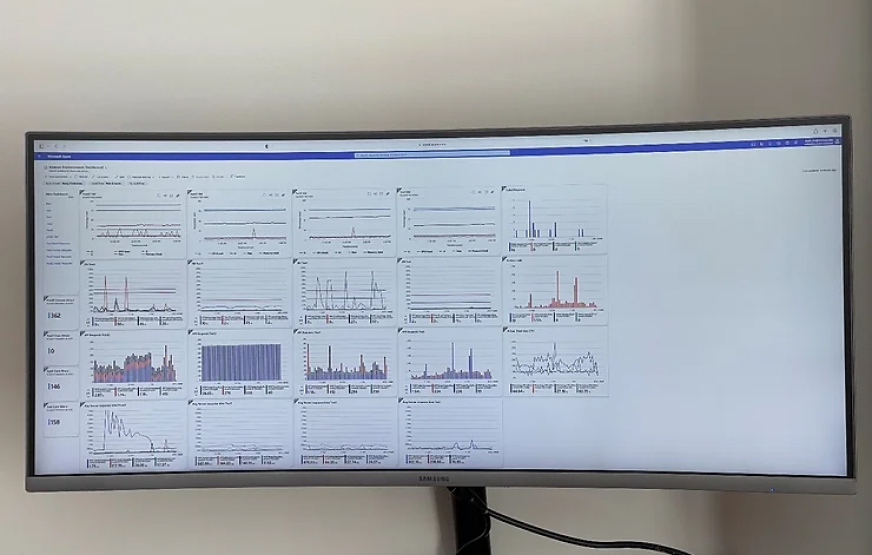
We now have a great dashboard that runs quietly by itself on the widescreen monitor behind me:

In the pipeline
For future development, we are working on a more business focused dashboard to track financial metrics. We also plan to improve the alert capabilities of our dashboard and monitoring.
Conclusion
We have a great Technical Dashboard showing performance in real time of all our production environments. The process of thinking about the reasons for the dashboard and analysing the results was very worthwhile.
Cheers, James


